Beat the Market (Part 1) - The Problem with "Buy and Hold the Index"
I know, I know. Trying to beat the market is a fool's errand. Most mutual funds underperform the index. Timing the market is the devil's work. Just hear me out for a minute.
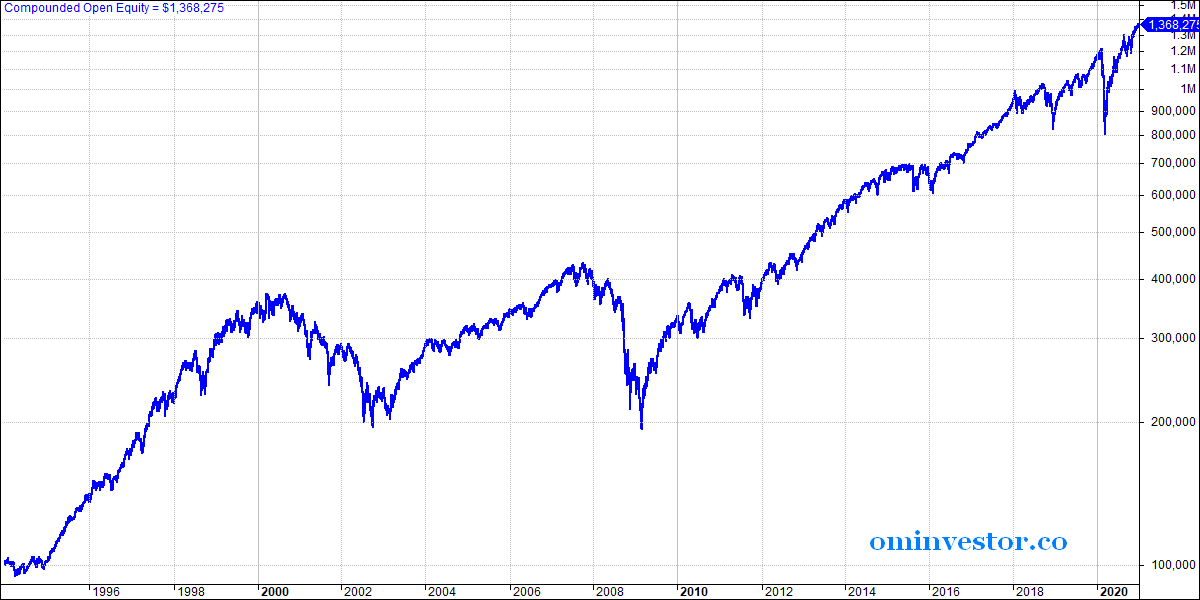
Yes, most investors likely will underperform versus a "Buy and Hold the Index" strategy. Let's first take a look at what kind of returns you can get with such a strategy. We'll use the S&P 500 Total Return Index (SPXTR), which includes capital gains and dividends, as our initial benchmark.
Returns from a "Buy and Hold the Index" strategy
Over a 27 year period from 1 Jan 1994 to 31 Dec 2020 you would have earned an annual return of 10.17% if you invested. That's nothing to scoff at. $100,000 invested at the beginning of the period would have become $1,368,275 at the end of it, or around a 13x return over a 27-year period.
There's just one small problem. You can't directly invest in an index. You'll have to do it through an index fund, which comes with fees that will lower your return.
Fortunately there are low cost Exchange-Traded Funds (ETFs) such as the SPDR S&P 500 ETF Trust (SPY) which has an expense ratio of just 0.0945%. There are ETFs such as VOO and IVV with even lower fees, but we'll stick with the SPY as it has a longer history that'll be helpful for our backtesting.
SPY has a 10.06% return over this 27-year period and you end up with $1,331,970 - close enough. The difference in return is almost equal to the fees charged. Makes sense.
If you invested in the SPY at the beginning of 1994 and went to sleep for 27 years, you'd be pretty pleased with your investing results at the end of it. I know I'd be. A 10% compounding return for 27 years with just a single trade is great. One and done.
The key problem with a "Buy and Hold the Index" strategy
If you're planning to go into stasis for a long period of time, then this is a decent strategy to pursue. The problem comes if you're awake during this stretch.

See those two dips in the chart above that look like the humps on a camel's back? They were gut-wrenching drawdowns of 40+% to 50+% each, and they happened twice within a decade.
Mr. Market is an adrenaline junkie who loves taking investors on a hellish roller-coaster ride. He does deliver the goods eventually, but most investors would have been flung off and ended up as bloody splotches on the grounds beneath the tracks.
Mr. Market is an adrenaline junkie who loves taking investors on a hellish roller-coaster ride.
When most investors look at a chart like the one above, they look at the money they can make and lick their lips, overrating their ability to endure the drawdowns.
But when they actually go through those drawdowns, they find themselves selling out in desperation or stifling sobs in the bathroom. If you were investing through the 2000 to 2002 and 2007 to 2009 period, you'll know what I mean.

We can better visualize the pain you'd have gone through as an investor by looking at an Underwater Equity chart, which measures the drawdowns from the last equity high. The thing to notice is the two sharp cliffs in the middle of the chart. Those are times when you would have been losing (big) money investing in the S&P500. The maximum drawdown in early 2009 was just over 55%.
If at the bottom of the market in early 2009 you were looking at a decade of -4% per year returns and had lost more than half of your investment, would you still have faith in the "Buy and Hold the Index" strategy?
If you had gone through a decade from 2000 to 2010 with huge volatility and basically zero returns, would you have had the steely determination to hold on for another decade to reap the market returns?
The key problem with the "Buy and Hold the Index" strategy is that most investors won't be able to stick with it. And thus they won't be able to get those decent (albeit volatile) returns.
The irony is that while most investors trying to beat the market will fail to do so, most investors just trying to match it by buying and holding the index will also fail. Us frail, emotionally weak human beings were not meant to succeed in this game of greed and fear.
And even if you were one of the few with guts of steel, you'd still have to go through a huge amount of pain. Even Spock would flinch.
Another problem with "Buy and Hold the Index" – lack of market diversification
The S&P 500 is a great index – it captures (roughly) 500 of the largest listed American (mainly) businesses, which have survived market competition and thrived.
But (sorry, my American friends) the world is more than just the U.S. of A. There are large, markets out there such as Europe, Japan and China (and many smaller ones) that could outperform the U.S.
While owning a single market index like the S&P 500 is certainly less risky than just owning an individual stock, it leaves investors exposed to the risk of poor returns over long stretches of time due to problems with that market.
But what if there were a better way?
Okay, we are getting into dangerous territory. I am going to go against conventional wisdom and suggest that there is an alternative strategy to "Buy and Hold the Index" that will likely (all investing is a game of probabilities and there are no absolutes or guarantees) result in higher returns with lower risk (and less pain).
There is a tradeoff – you'll need to do a bit of work (~5-10 minutes) every month (and there'll be ways to reduce this to almost nothing), and you might have to place trades a few times a year to buy and sell some ETFs.
It's a rules-based strategy that will help to take the emotion out of investing so we can avoid the inescapable behavioral finance traps (i.e. knowing about them doesn't really help us to avoid making those mistakes).
We'll go into the details of how this strategy works in the following installments but for now here are the backtested results:
NOTE: This is not financial advice. Results are hypothetical, do not indicate future results, and do not represent returns any investor actually attained. Please read the Disclaimer page for more information.
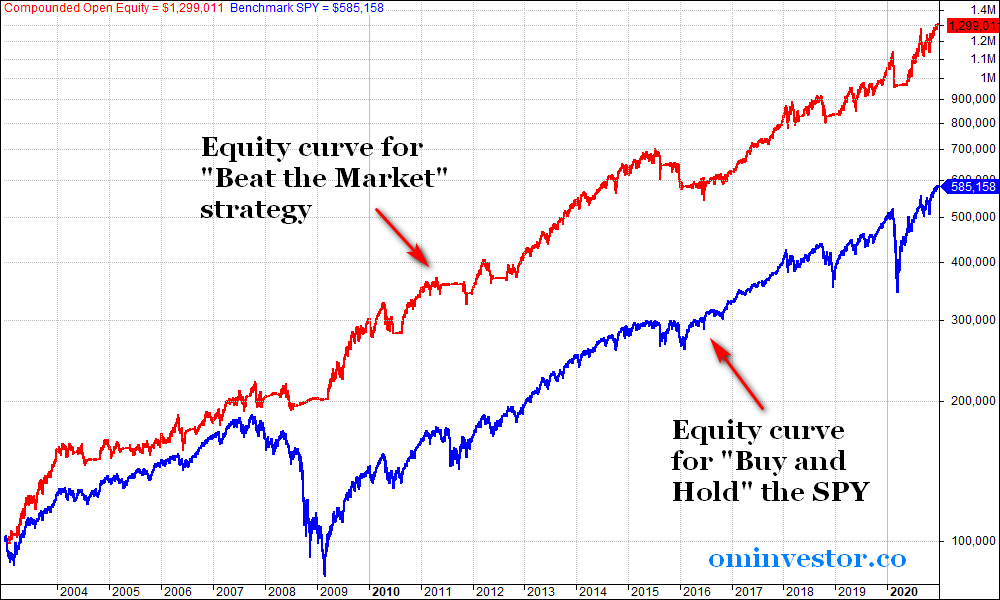
For the 18-year period from 2003 to 2020 (we start from 2003 as some of the ETFs we are using were not listed before this), my "Beat the Market" strategy returned 15.30% per year versus the 10.31% of "Buy and Hold the SPY".
With a hypothetical investment of $100,000 in this strategy in 2003 you would have ended with $1,299,011 at the end of it, versus $585,150 invested in the SPY, around 220% more.

And you would have done it with a lot less pain. Versus a maximum drawdown of 55.2% of the "Buy and Hold the SPY", the "Beat the Market" strategy was down at most 22.5%.
Sounds good? Hope you're looking forward to Part 2 of this series, where we will examine the concept of momentum, which is a key part of this strategy.